At AnalyticVue, we believe that the best ideas often come from the community we serve. That’s why our monthly User Group Meetings aren’t just product updates—they are working sessions, think tanks, and support networks for K–12 districts across the country who are using data to drive real change. In March, that spirit of collaboration reached a new level as we held our first hybrid User Group meeting—broadcast virtually while also convening in person at Clayton County Public Schools in Jonesboro, Georgia.
This gathering was particularly special. Not only was it an opportunity to connect face-to-face with Clayton County’s incredible team, but it served as a platform for educators from districts nationwide to discuss progress, pain points, and the possibilities ahead.
A Platform That’s More Than a Product: Why Clayton County Chose AnalyticVue
Clayton County’s partnership with AnalyticVue began like many others—through word of mouth. Dr. Delphia Young, the district’s Deputy Superintendent of Teaching and Learning and Strategic Improvement, heard about AnalyticVue while discussing data challenges with colleagues from nearby Henry County Schools.
“If it weren’t for Henry County, I wouldn’t have been sitting in a meeting expressing the need for easier access to data. They mentioned they were rolling out AnalyticVue, and I said, ‘OK, let’s partner. Let’s see what we can do.’”
– Dr. Delphia Young
What followed was a highly collaborative, locally supported implementation—one that’s been shaped by a shared commitment to transparency, accountability, and community communication.
“The work that we’re doing is really driven by the need for Clayton County Public School to have a dashboard that allows our teachers and leaders and members of the board and the community to really see what we’re doing.”
– Dr. Delphia Young
A Smooth Rollout Built on Trust and Responsiveness
Across the board, the Clayton County team highlighted the exceptional customer service and hands-on support they received during the rollout. With several large-scale initiatives happening simultaneously across the district, the ability to partner with a team that was both responsive and adaptable made all the difference.
“AnalyticVue is small enough, yet large enough to be able to have people right here in our city visiting us to hold our hands and to guide us through the work. And so that level of customer service is very, very, very rare.”
– Dr. Delphia Young
From infrastructure to insight, implementation was fast, seamless, and well-coordinated.
“I’ve gone through numerous implementations and even implementations of data dashboards. This has been one of the smoothest processes that I’ve had since I’ve been in this type of work, which has been over a decade.”
– Howard Langford, Executive Director of Technology
Empowering People Through Visibility and Simplicity
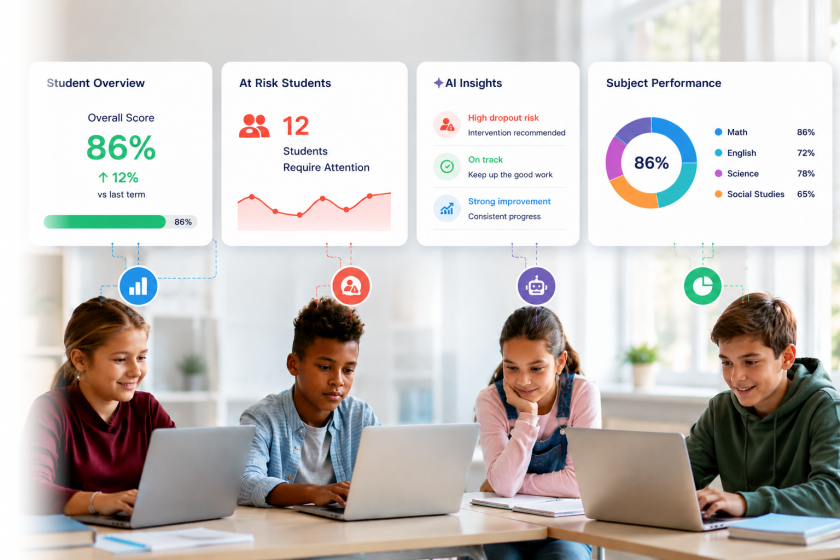
What makes a dashboard powerful? According to Jacquelyn Johnson , Director of Research, Evaluation, Assessment and Accountability, it’s not just about access to data—it’s about having the right data, clearly visualized, to support strategic planning and continuous improvement.
“We’re finding the AnalyticVue product to be very good. The dashboards, all the dashlets are really helping us visualize the key performance indicators that we need to monitor… because once you have the metrics built, then you can talk about the processes that need to be established or refined.”
– Jacquelyn Johnson
She also shared how the dashboard has become a unifying tool for departments that previously may have operated in silos:
“This dashboard is helping Clayton unite our large departments together, with a clear succinct focus on the right data that will drive our decisions, moving from compliance to strategic actions and improvements.”
– Jacquelyn Johnson
Customization and Collaboration That Scales
A major theme throughout the meeting was customization. Rather than force districts into rigid structures, AnalyticVue empowers them to tailor dashboards to their unique needs.
“Everything we’ve asked them to do, they’ve been able to customize for us.”
– Dr. Zawdie Jackson, Data Coordinating Supervisor
“Their templates were very helpful. They also give great ideas as far as the different dashboards that we could actually use, which was very helpful.”
– Tamika King, Coordinator for Enterprise Information Systems
The implementation team shared how useful it has been to not only build new features, but co-create them based on real needs expressed by districts. Many of these ideas are shared and refined in User Group meetings themselves—turning feedback into new functionality.
Topics that Matter: What’s Next for the User Group Community
This month’s session wasn’t just a reflection on Clayton County’s progress. It was also a forward-thinking forum where attendees proposed future topics and feature ideas that matter to them.
Some of the top themes included:
- Data Literacy & Usage: Helping teachers and leaders understand how and when to use data, not just what data exists.
- Heat Maps & Geolocation Data: Visualizing patterns by zip code, school location, attendance, staffing origin, and more.
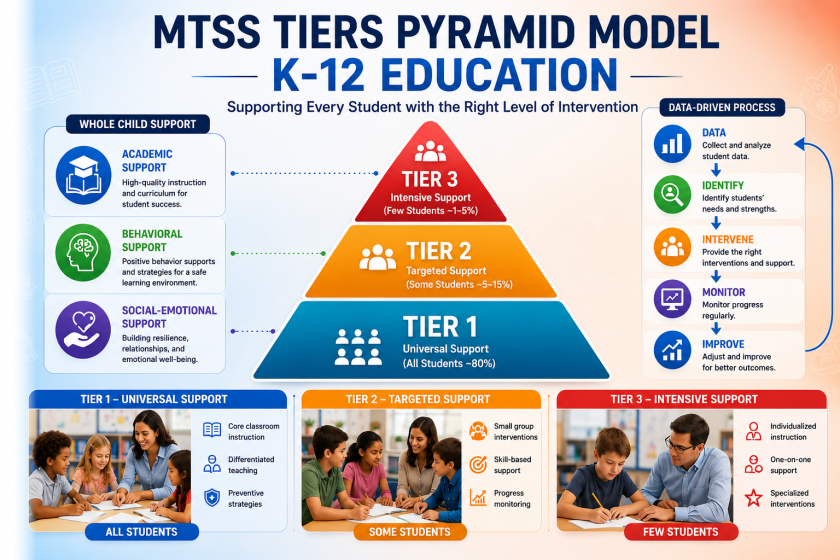
- MTSS & Intervention Tracking: Identifying the data that supports tiered intervention models, progress monitoring, and student growth over time.
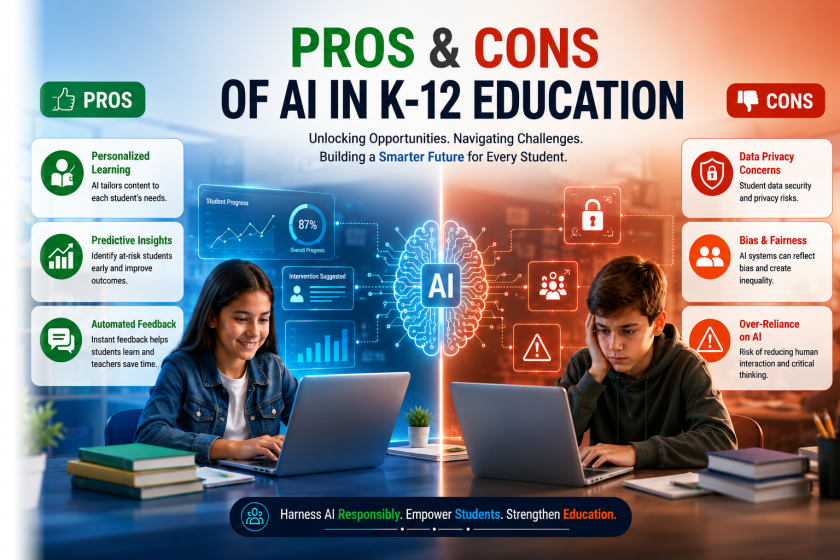
- Predictive Analytics: Surfacing indicators of risk or achievement before they become problems—or opportunities missed.
- Triangulation of Assessments: Mapping relationships between different testing instruments to track student learning trajectories.
These ideas weren’t just shared—they were energized by stories from multiple districts, from East Hartford, CT to Framingham, MA, who are exploring these very strategies in their own schools.
A Learning Community That Builds Together
Throughout the session, AnalyticVue’s Chief Data Officer, Manos Stefanakos, encouraged district leaders to continue bringing their toughest questions, boldest ideas, and most pressing needs to the table. His message was clear: these User Group meetings are for the community, by the community.
“In my dream scenario, I introduce the meeting, and then I listen and take notes and learn from you all.”
– Manos Stefanakos
As Manos pointed out, it’s not just about building tools—it’s about building capacity, and doing it in a way that is inclusive, collaborative, and responsive.
“The more people that use AnalyticVue, the more we learn about ways we can make it better.”
Final Thoughts: The Power of Coming Together
While virtual meetings have allowed our community to stay connected from coast to coast, this hybrid gathering proved something else: there’s nothing quite like getting together in person.
We’re incredibly grateful to Clayton County Public Schools for hosting us, for their openness, and for inspiring others through their work. Their partnership reflects everything we strive to build at AnalyticVue: trust, insight, and a shared commitment to improving outcomes for every student.
To all of our current partners—and to those exploring what’s possible—we invite you to join us. Not just as users, but as co-creators of the future of education data.
Interested in joining our next User Group Meeting or learning more about how AnalyticVue is helping districts like Clayton County?
[Contact Us] or [Request a Demo] to start the conversation.