Reframe around student growth and hope: Rather than positioning data as purely a technological solution, emphasize that its proper use can “foster hope” and give educators a pathway to help students succeed.
Using student data to improve teaching and learning is now, without a doubt, a central element of the modern-day educator’s playbook. As institutions start to utilize resources like online tools more and more, data has become ubiquitous.
However, given that the data is typically fragmented on separate systems, most institutions have a mountain to climb when it comes to successfully deploying the data available to create fruitful, personalized learning experiences for their students.
At AnalyticVue, we have spent decades developing a comprehensive solution that addresses precisely this issue. We have helped institutions across the United States not just to understand their data, but to overcome the resource limitations clients commonly face. This helps build a more complete picture of students and supplements the student performance observations teachers typically get by using assessment in instruction.
In this article, we’ve taken the lessons we’ve learned over the past two decades, to offer practical solutions so that you too can positively impact student outcomes. We look at how to use data to improve student learning and by the end, you should have a much more detailed understanding of what is involved in effectively using data to inform teaching and learning.
What is student data?
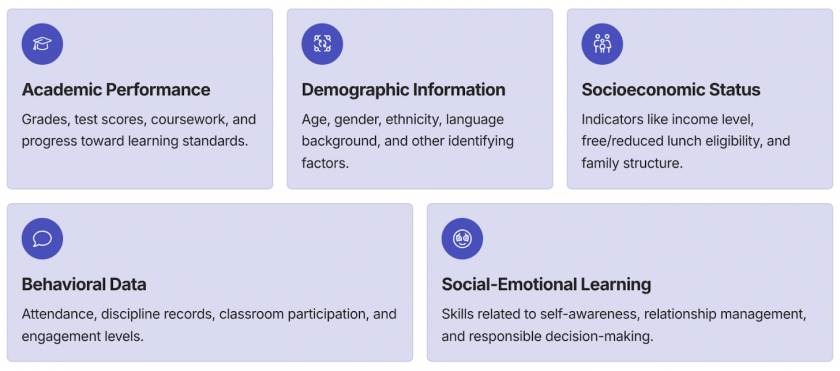
Student data is the information schools gather about students that is relevant to their educational experience.
A platform like AnalyticVue platform goes further in specificity and tracks data points that provide a more holistic picture of the student, and insights about how to help them be successful at group and individual level.
The platform gives visibility into details such as standards mastery, and captures data that can be used to identify groups of students who might have needs. It also provides more information about the students themselves – things like social-emotional learning, and behavioral data beyond just discipline.
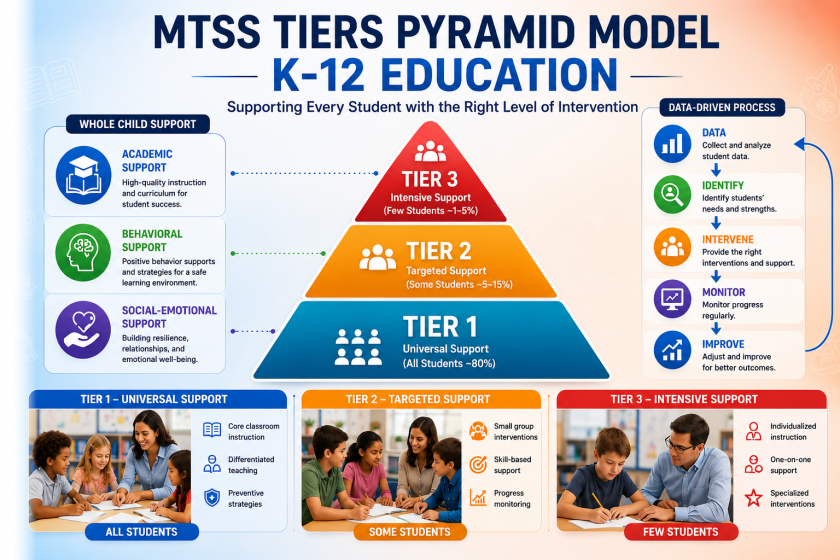
Types and Levels of Data
-
Satellite data:
- High-level, wide-angle view of performance.
- Examples: state assessments, standardized tests, district-wide benchmarks.
- Purpose: This data helps leaders and policymakers track overall trends, not individual students.
-
Map data:
- Mid-level, zoomed-in perspective.
- Examples: school-wide results, grade-level performance, subject trends.
- Purpose: This data helps school leaders and teachers spot group strengths/weaknesses and allocate resources.
-
Street data:
- Ground-level, most detailed view.
- Examples: classroom work, teacher observations, student reflections, daily behaviors.
- Purpose: This data provides context and nuance, showing the “why” behind patterns in satellite or map data.
Using Student Data to Improve Teaching and Learning
Comprehensive, well-formatted data about students’ academic achievement, learning behaviors, and personal traits helps educators develop targeted teaching tactics, set up individualized learning experiences, and track progress more effectively.
Student data helps institutions to:
Predict student achievement: Institutions can use the predictive models provided by a platform like AnalyticVue to forecast future student performance, address possible issues, and capitalize on opportunities to improve learning outcomes.
This is possible thanks to artificial intelligence, machine learning, and other models that provide more detailed data to identify areas of need by analyzing past performance of students, giving the schools both the expected result, and the factor that would lead to it.
Affect the dropout rate: Institutions can detect early warning signs and risk factors connected with dropping out by studying student data. This allows them to create timely interventions and support systems to assist students in overcoming barriers.
Identify and address student needs: Recognizing learning needs allows educators to design more effective learning experiences. This could be a personalized approach that ensures that specific kids receive the appropriate assistance, or at a group level if the need affects a particular subset of students. This will increase academic achievement and students’ individual well-being in the classroom.
Improve assessment programs: using student data, schools get useful information on the effectiveness of assessment tools and techniques. They can then use these findings to improve assessment programs, and ensure that they accurately measure student learning and provide useful feedback. They make sure that curriculums are aligned with the way students are assessed.
Optimize resource allocation: The reality is that there is not an infinite amount of people and Resources to address all of the challenges that educational institutions face. Student data enables institutions to identify where more assistance or resources are needed, and ensure that funding and efforts are directed toward the most impactful initiatives.
Democratize data analysis: Data-driven insights are made accessible and comprehensible to a broader range of stakeholders, including teachers, administrators, and even students themselves. This is due to simplified data analysis tools with user-friendly interfaces that assist stakeholders in making data-driven decisions.
Analyzing Student Data: A Smarter Way to Drive Instruction with AnalyticVue
The content is yet to be provided.
How Teachers Use Data to Improve Instruction: A Step-by-Step Process
Using student data to improve teaching and learning involves a systematic approach that encompasses data collection, analysis, and implementation.
Let’s go over how teachers use data to improve instruction and create personalized learning experiences, and for improving learning outcomes for students.
1 Gather all the student performance data

Let’s move to the next step which is all about collecting the data of student learning. When thinking of how to analyze student performance, the most important stage to work on is collecting data from a certain number of sources beforehand. ‘Why is it so important?’ you may ask. Well, here is why: with the help of such activities as annual state assessments, chapter tests, interim district and school assessments, classroom performance data, and other pertinent data, teachers can easily obtain a robust understanding of students’ learning requirements and use achievement data for improving teaching and learning. A district-wide data system enables teachers to aggregate data by classroom, curriculum area, or assignment type in order to uncover performance patterns.
In point of fact, teachers can actually gather information in a variety of methods. Formal evaluations, such as exams, essays, or final projects, are among the more traditional techniques for gathering data. Individual development shows through assessments, as well as patterns in the classroom as a whole.
Another way to collect data is through observation. Teachers can observe a class to see how effectively students absorb and engage with information, both individually and collectively. Because of the fact that no single assessment can provide all of the information teachers need, using multiple data sources markedly helps to come up with informed instructional decisions.
Here are some characteristics of interim assessments:
- Routinely administered during each school year (e.g., every semester, every quarter, every month);
- Managed consistently via a given school or district level and/or curriculum area;
- Administered on paper or digitally;
- Commercial or developed in-house;
- Scored by a computer or a person.
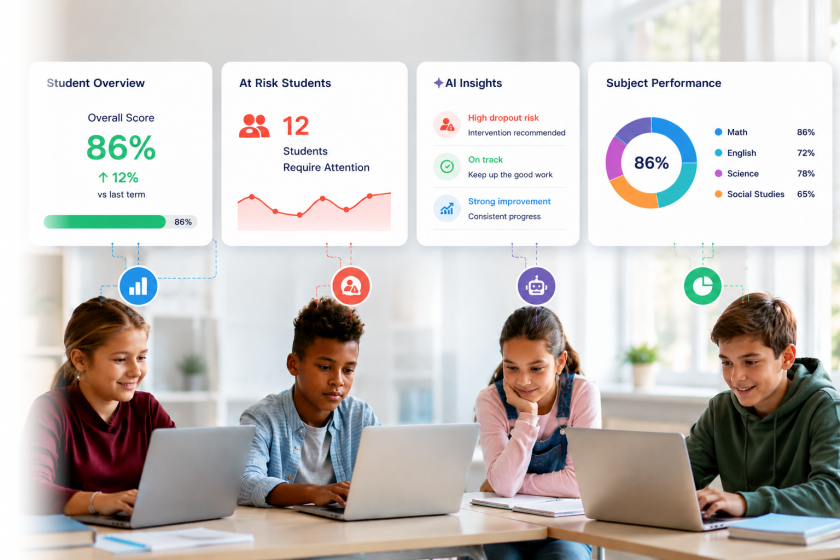
Some of the education institutions already improve their data analysis programs through the use of real-time dashboards which help students by collecting and updating student data profiles utilizing a number of data points, ranging from financial information to academic success. In certain high schools and other institutions, they already actively experiment with real-time data collection systems.
AnalyticVue is a great platform for collecting and organizing important K12 data, which includes enrollment data, student grades, attendance rates and dropout rates across classrooms, schools and districts, FRL share, percentage of students with disabilities and more. AnalyticVue organizes these data in easy-to-read charts and dashboards to make it easier for all educational stakeholders to find and analyze data patterns, leverage predictive analytics and make data-driven decisions.
2 Examine the collected data

Teachers can use data interpretation to determine the strengths and shortcomings of an entire class as well as individual students. The ability to generate hypotheses about factors that affect students’ learning and methods to enhance education to assist all students as they review the data is a great thing! During this stage of the instructional improvement cycle, teachers must slow down and ask why.
The initial goal in analyzing data is to determine the overall areas of relative strength and weakness in each class so that instructional time and resources may be devoted to the most pressing instructional requirements.
The second goal is to determine each student’s strengths and weaknesses so that assignments, teaching techniques, and feedback may be tailored properly.
3 Form hypotheses on how to enhance teaching and learning and test them

To ensure your students enhance their learning process, you should generate ideas about how to on your side improve the accomplishment patterns they find as they triangulate data from different sources. Good hypotheses arise from current data, indicate instructional or curricular modifications that are likely to increase student learning, and may be evaluated with future assessment data.
Teachers may hypothesize that they need to implement different methods to teach the same subject. Teachers might choose between reasonable theories by considering how they and their colleagues have previously taught specific skills. You may discover, for instance, that students struggle to identify the primary concept of texts they read. So you may make a conclusion that the student performance isn’t as good as you expected and that you should try delivering information about that skill in a different way now.
When communicating with other instructors, you may decide to use a different teaching method, such as a discussion format in which students not only identify the key concept of a book but also arrange a debate game on its evidence.
Testable theories have certain characteristics:
- Choosing a promising intervention or instructional change, as well as an expected outcome;
- Making sure that the effect can be quantified;
- Identifying the data for comparison.
After developing hypotheses regarding students’ learning requirements, teachers can analyze present instruction and put the hypotheses to the test by adopting instructional modifications they feel would improve student accomplishment. Teachers must decide whether to continue the educational improvement in its current form, change or extend the technique, or try a different approach based on the findings.
The following are some common strategies of how to test hypotheses:
- Dedicate extra time to important skill teaching;
- Provide extra assistance to individual students with specific skills;
- Use a variety of teaching methods for difficult subjects;
- Reteach or pre-teach abilities that students appear to find difficult to comprehend;
- Align expectations for performance across classrooms or grade levels;
- Improve the alignment of the curriculum
Here is an example: if student assessment results suggest that they are struggling with two-digit multiplication, instructors may decide to devote an extra 30 minutes to this skill for one week and then retest students to determine if their proficiency has improved. The kinds of improvements educators prefer to make might range from minor to major.
Those include one or more of the following:
- Investing additional time in topics where learners are having difficulty;
- Trying innovative approaches to teaching difficult or complicated subjects, particularly those based on best practices found by colleagues in the classroom;
- Rearranging the curriculum to reinforce important abilities that students are lacking;
- Designating certain students for extra assistance with specific skills (i.e., grouping or regrouping pupils);
- Enhancing the alignment of instructional emphasis across grade levels;
- Increasing the alignment of performance standards between classes or grade levels.
4 Adjust the curriculum

Curriculum adaptation to student requirements is also essential. The courses offered should be examined by conducting a good examination of the data throughout the program evaluation process. Online courses are nearly always highly requested, and it is sometimes a deal breaker whether a school provides such programs or not. It could be time for you to increase your online offers if registrations are decreasing. See your information first to find on-campus courses with low registrations or low success rates. If they were provided online, would these classes be better for students?
Finding instructional or curricular modifications is important in increasing student learning and they can be tested using future assessment data. Existing data, for example, might show areas where the school’s curriculum is not properly matched with state requirements. Teachers may legitimately believe that rearranging the curriculum to address previously ignored content will improve students’ understanding of the standards in certain instances.
5 Encourage students to work with their own data and teach them to set learning goals
Teachers should give students specific instructions on how to use accomplishment data to track their own progress and set their own learning objectives on a regular basis. When students understand the learning objectives and get data in a user-friendly manner, they are best equipped to learn from their own achievement statistics. Rubrics provide students with a clear idea of what they’re studying, and data presented in an accessible and descriptive way can reveal students’ strengths and deficiencies.
6 Define assessment criteria and expectations

Students must grasp how their performance fits within the framework of classroom-level or school-wide standards in order to evaluate their own accomplishment metrics. Teachers should communicate the subject knowledge and abilities that they anticipate students to gain during the school year, including goals for individual lessons and assignments, as well as unit and year-end results. Teachers should spell out the criteria that will be used to evaluate students’ progress toward their objectives.
When teachers use a rubric to assess students, for example, instructors should introduce the rubric at the start of the assignment so that students understand which criteria are crucial before they start working on a task or project. Students should get the completed rubric from the teacher once their real tasks have been completed and reviewed.
Teachers can help students to comprehend the state standards they are expected to fulfill by reviewing the standards throughout the year since many public school students in many grades are required to take yearly standards-based accountability exams in selected areas.
7 Feedback is important to students

Provide students with timely, detailed, and well-formatted comments. Teachers can give students feedback that highlights specific areas for growth and helps them understand their strengths and limitations. Student-created assessment rubrics and peer evaluations are both effective tools and techniques. Students will require time and resources to evaluate data, detect mistakes, and learn from comments. Students’ data analysis is guided by tools like teacher- and student-generated graphs and reflective questions, which help them make data-based decisions to enhance their performance.
Feedback may have the following characteristics:
- Timely (Feedback related to a specific skill that is returned to the student as soon as possible);
- Appropriately formed (Feedback formed in the specific mode of delivery that best suits students’ needs; a teacher should choose whether handwritten or typed feedback is more appropriate based on the task);
- Specific feedback with constructive criticism (Feedback, regardless of format, should include specific details and suggestions for improvement).
8 Use students’ data to implement changes in the learning process

Although data analysis technologies assist students in learning through teacher feedback, they also offer teachers useful information for informing instruction. Teachers should gather and analyze students’ objectives and analyses in order to discover topic areas and abilities that need to be reinforced, as well as variables that may drive student learning.
The examples of possible changes may include:
- Examining mistake worksheets to find concepts/standards that need to be taught again;
- Arranging small-group education around the subsets of goals that students identified as most important to them;
- Compiling a list of the ideas that students in the class identify as their weaknesses, and then conducting a full-class review of the most commonly reported flaws.
9 Promote a data-driven culture

Members get a full grasp of their data-related duties and responsibilities. Leadership, professional development, and collaborative time don’t create a data-driven culture; rather, they give the resources necessary to encourage data-driven instruction and decision-making.
To begin using student data to improve teaching and learning, educators should collaborate with all teachers, administrators, and district officials to put the essential measures in place in their schools. When it comes to data-driven education, collaboration is crucial.
Educators should utilize supporting charts or graphs to show what approaches have succeeded, what challenges still exist, and any discoveries that might benefit the entire educational community. In this way, teachers can start to adopt certain common teaching and assessment techniques together, as well as predict common student performance expectations.
Charting and tracking students’ changes in growth can help to discover what lacks in current performance. Once the team finds out what exactly the gap is, they can work together to fill it, applying specific strategies.
According to research that edutopia.org has conducted, the Edutopia school was able to significantly boost their students’ achievements when they started using data in this way: over the first semester, 84% of their students improved by an average of 17 percentile points.
A lot of educational institutions still rely on spreadsheets to organize and manage data, which makes data collection and visualization a challenge. Here, AnalyticVue is very helpful, as it helps gather data and organize it into customizable role-based dashboards, both for students and educators.
10 Make the analysis of student data a part of a continuous instructional improvement cycle

All teachers want to help their students succeed. How can we achieve this? To do so, educators must have a complete understanding of how to use data in schools. Teachers work with student data to inform instructional decisions and address students’ learning requirements in a systematic and routine manner. On the other hand, data usage is a continuous cycle of gathering data from different sources, evaluating data to create hypotheses about strategies to improve student accomplishment, and making instructional adjustments to test ideas.
But did you know that collaboration among teachers at each stage of the data-driven inquiry process can maximize the benefits of data use by helping students in sharing effective practices? Even more so, it helps to adopt collective expectations for student performance, gaining a deeper understanding of students’ needs, and developing effective strategies to better serve students.
At this stage, you should understand that data-driven teaching is a cyclical process. And by engaging in a cycle of instructional improvement, teachers may utilize data to drive their instructional decision-making and enhance their capacity to fulfill their students’ learning needs.
This cycle contains the following steps:
- Gathering and compiling pertinent information regarding student learning;
- Analyzing the data and formulating ideas about what guarantees students to improve;
- Evaluating the impact of created hypotheses by adopting modifications in instructional practices.
Teachers may continue the cycle by collecting and interpreting further student accomplishment data and testing hypotheses. This will help a lot in the future!
11 Arrange continuous professional development for educators

Educators must possess a wide range of abilities in order to effectively work with student data analytics to detect achievement issues and design instructional solutions. Schools and districts must provide continuous professional development opportunities for administrators, principals, teachers, and classroom support specialists in order to improve data literacy and data-use abilities in a way that is compatible with school goals. Without school and district support for these opportunities, data analysis may be uneven and potentially unproductive.
It is critical to understand that professional development responsibilities don’t end with initial staff training and the implementation of the district’s data system. Users may also require continuing technical support, and further training will be required when system upgrades are implemented.
As a result, professional development opportunities should be ongoing, given at least once a month throughout the school year by employees with experience in assessment and data literacy, technology use, and the establishment of data-driven cultures.
Conclusion
The proper use of student data has far-reaching benefits, both for educational institutions and students. Educators can develop individualized learning experiences, manage resource allocation, and address individual needs more effectively by collecting, and evaluating the appropriate student data.
AnalyticVue facilitates this by providing powerful, smart, and user-friendly tools, combining big data technologies, educational data models, and the knowledge of experienced education data analysts to help you evaluate data and uncover actionable insights.
It also democratizes the data analysis process by making what are complex processes, techniques, and algorithms accessible to non-experts. This enables you to go beyond just test scores.
Use the guide we have provided here to support, engage, and create opportunities for students along their education journey, use data to improve student learning, and enhance your administrators’ and teachers’ instructional decision-making, resulting in a data-informed learning environment that has the ability to dramatically improve student achievement.
Frequently Asked Questions