Schools today have more k-12 data than ever, but most still struggle to use it effectively. Information is scattered across the SIS, the LMS, assessment platforms, attendance trackers, and behavior logs — leaving leaders to make decisions based on assumptions or wait days for the right report. The result is delayed interventions, missed warning signs, and frustrated teachers. K-12 data analytics is the bridge: it converts raw student performance data into clear, actionable insights. This article covers how analytics improves student outcomes, supports decision-making, and what tools and practices schools need to put the strategy into action.
What is K-12 Data Analytics
Put simply, K-12 data analytics is the process of collecting and analyzing student and school data to inform teaching, support, and leadership decisions. Modern k12 analytics systems combine multiple data streams in one place:
- Academic data — grades, formative assessments, benchmarks, state tests
- Attendance and behavior — daily attendance, tardies, discipline records, classroom observations
- Engagement data — participation, time-on-task, LMS interactions, assignment completion
Together, those signals form the foundation of a complete student profile — the kind of profile a teacher would build by hand if they had unlimited time. Analytics removes the manual lift.
Why K-12 Data Analytics is Important
The core issue most districts face is being data-rich but insight-poor. The data exists — it just isn’t structured, surfaced, or shared in a way that drives action. Here’s the impact when analytics is missing:
- Delayed interventions — students struggle for weeks before anyone notices the warning signs.
- Poor decision-making — leadership relies on memory, anecdote, or stale reports instead of current data.
- Inequitable resource allocation — the loudest squeaky wheel gets the support, not necessarily the student with the greatest need.
A purpose-built K-12 data analytics platform closes those gaps by making the right insight available to the right person in seconds, not days.
How K-12 Data Analytics Improves Student Performance
Analytics doesn’t improve outcomes on its own — but the actionable insights it surfaces do. Here are the four highest-impact ways schools track student performance data to drive growth:
Early Identification of At-Risk Students
By continuously monitoring attendance, grades, and behavior, schools spot warning signs weeks before they become crises. Predictive flags let interventionists start support while there’s still time to reverse the trend.
Personalized Learning
Schools can monitor each student’s improvement and compare their performance against grade-level benchmarks, then tailor instruction to fill the specific gaps an individual student carries.
Improving Teaching Strategies
Teachers use class- and student-level k-12 data to identify gaps in mastery, refine pacing, and adjust lesson plans so future instruction directly targets where students struggled most.
Continuous Feedback and Improvement
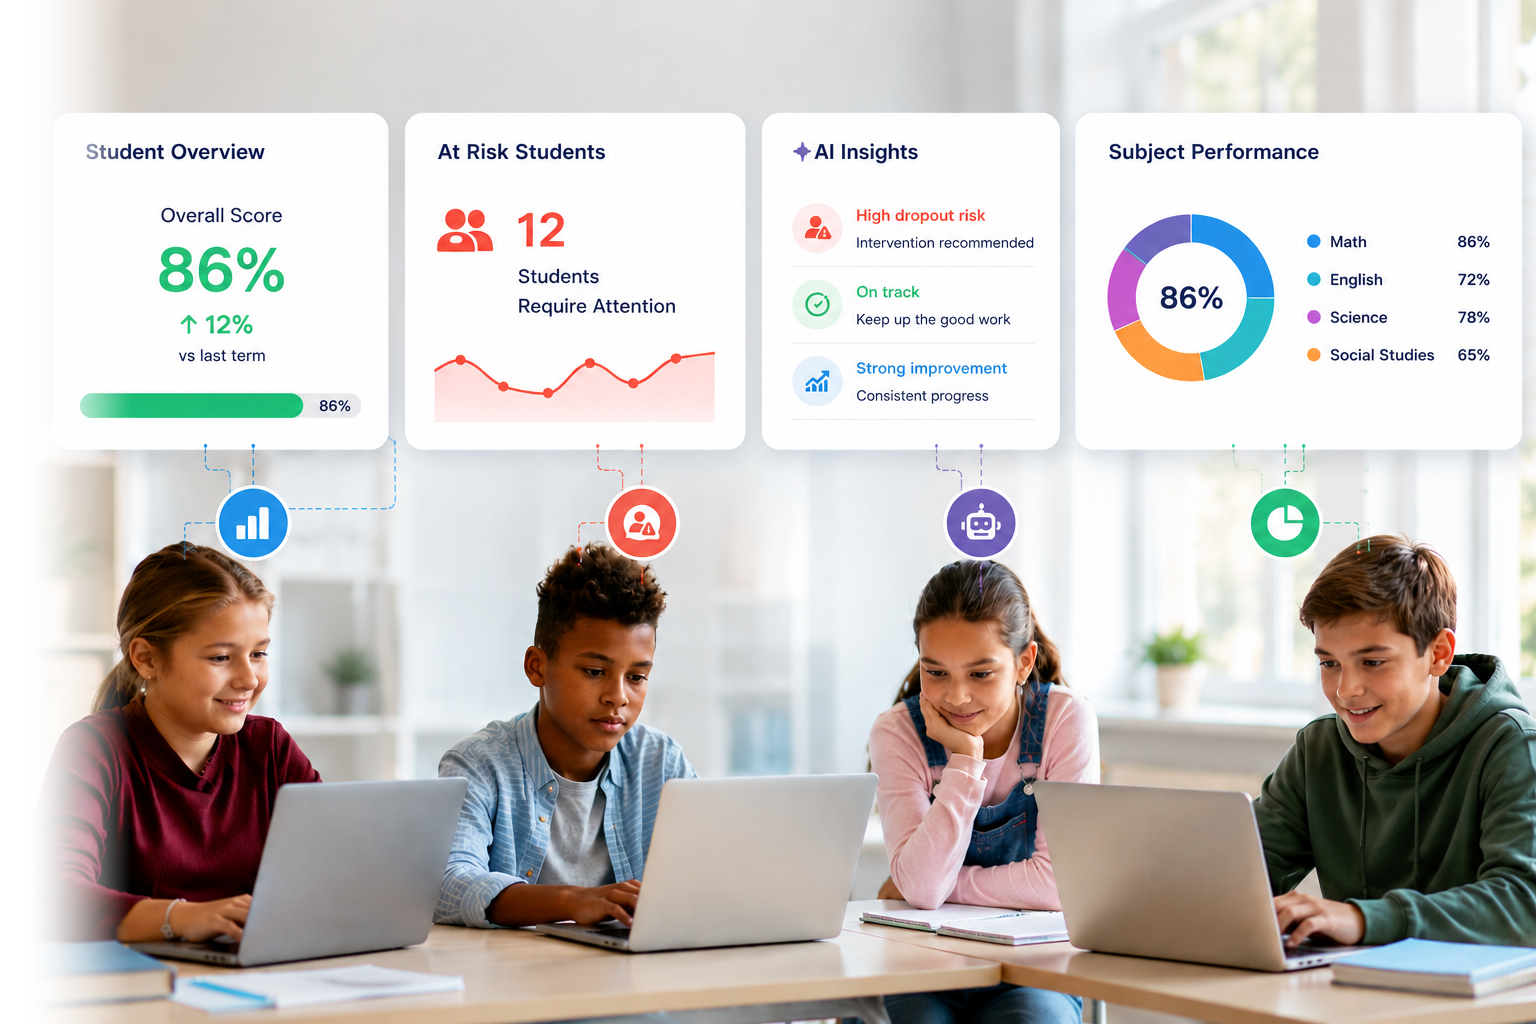
Real-time dashboards give students, families, and teachers immediate insight into progress. Faster feedback loops mean students improve faster and self-monitor their own learning.
How K-12 Data Analytics Improves Decision Making
Beyond classrooms, k-12 analytics reshapes how leaders run the school. The five practical wins below show why analytics is now a leadership tool, not just a teacher tool.
Data-Driven Instruction
Teachers adjust lesson pacing, grouping, and re-teach decisions based on live student data — improving classroom outcomes without waiting for the next assessment cycle.
Better Resource Allocation
Leaders see exactly where staff, budget, and time are needed most — and can reallocate quickly instead of spreading resources thin across all schools.
Faster Decision Making
Real-time dashboards remove the lag between “What’s happening?” and “What do we do?” — turning week-long decision cycles into same-day action.
Identifying Trends and Patterns
Districts spot recurring performance gaps, multi-year trends, and equity issues that aren’t visible in any single report or term.
Strategic Planning
Leadership uses longitudinal data to plan improvement initiatives, set measurable goals, and track progress against district priorities.
Role of Student Data Systems in K-12 Analytics
Student data systems are the foundation that makes meaningful analytics possible. Without a centralized backbone, every dashboard is built on quicksand. Effective systems do two things well:
- Provide centralized data — one source of truth for every student’s record across all years and schools.
- Integrate data from multiple tools — pulling in SIS, LMS, assessments, attendance, and behavior into a single, queryable layer.
Key Tools Used in K-12 Data Analytics
Schools rely on a small stack of purpose-built tools to manage and analyze student data:
- Data dashboards — visual, role-specific views for teachers, principals, and district leaders.
- Student Information Systems (SIS) — the system of record for enrollment, demographics, and grades.
- Analytics platforms — purpose-built layers that combine SIS, assessment, and behavior data and surface it through dashboards and predictive models.
Together, these tools help educators visualize data and analyze student performance trends without writing a single SQL query.
Common Challenges in K-12 Data Analytics
Even districts with strong tools hit predictable obstacles. Here are the four most common — and how to address them.
| Challenge | What it looks like | How to fix it |
|---|---|---|
| Data silos | Data lives across separate systems with no shared identity layer | Adopt a centralized analytics platform that integrates the SIS, LMS, and assessment tools |
| Data overload | Dashboards are crowded with metrics no one acts on | Curate a small set of indicators tied to specific decisions teachers and leaders actually make |
| Lack of data skills | Teachers and leaders have data but don’t know how to interpret it | Provide ongoing training and embed data routines into PLCs and leadership meetings |
| Data privacy concerns | Worry about FERPA, sharing controls, and student record exposure | Use platforms with role-based access, audit logs, and FERPA-compliant infrastructure |
Data Silos
When data lives in five different systems, no one gets a complete view of any student. The fix: centralization.
Data Overload
Too much data — without prioritization — paralyzes decision-making. Focus on a small set of decisions you want the data to drive.
Lack of Data Skills
Many teachers were never trained to interpret dashboards. Build data literacy into professional development from day one.
Data Privacy Concerns
Compliance with FERPA and state privacy regulations is non-negotiable. Choose platforms that build privacy into the architecture, not as an afterthought.
Best Practices for Using K-12 Data Analytics
- Centralize data — bring every source into a single platform with one shared student identity.
- Use dashboards for visualization — color, trends, and charts surface insights faster than tables of numbers ever will.
- Train staff to use data effectively — every educator should be able to read the dashboard relevant to their role.
- Review data regularly — embed weekly or bi-weekly data huddles into team routines.
- Focus on actionable insights — every metric should answer “What do I do differently because of this?”
Conclusion
K-12 data analytics improves student performance by surfacing the early signals that lead to faster, more targeted interventions. It improves decision-making by giving leaders the live, integrated picture they need to act with confidence. And it makes schools more proactive — replacing the cycle of “wait, then react” with “see, then act.” Districts that invest in centralized analytics, train their people to use it, and focus relentlessly on actionable insights consistently outperform those that don’t. Better data really does equal better decisions, and better decisions lead to better outcomes for every student.